3 YouTube Metrics That Actually Matter (And 2 That Are Just Vanity)
Key Takeaways
- 1
Click-through rate and subscriber count feel important but rarely predict channel revenue or long-term reach — learn which numbers actually move the needle.
- 2
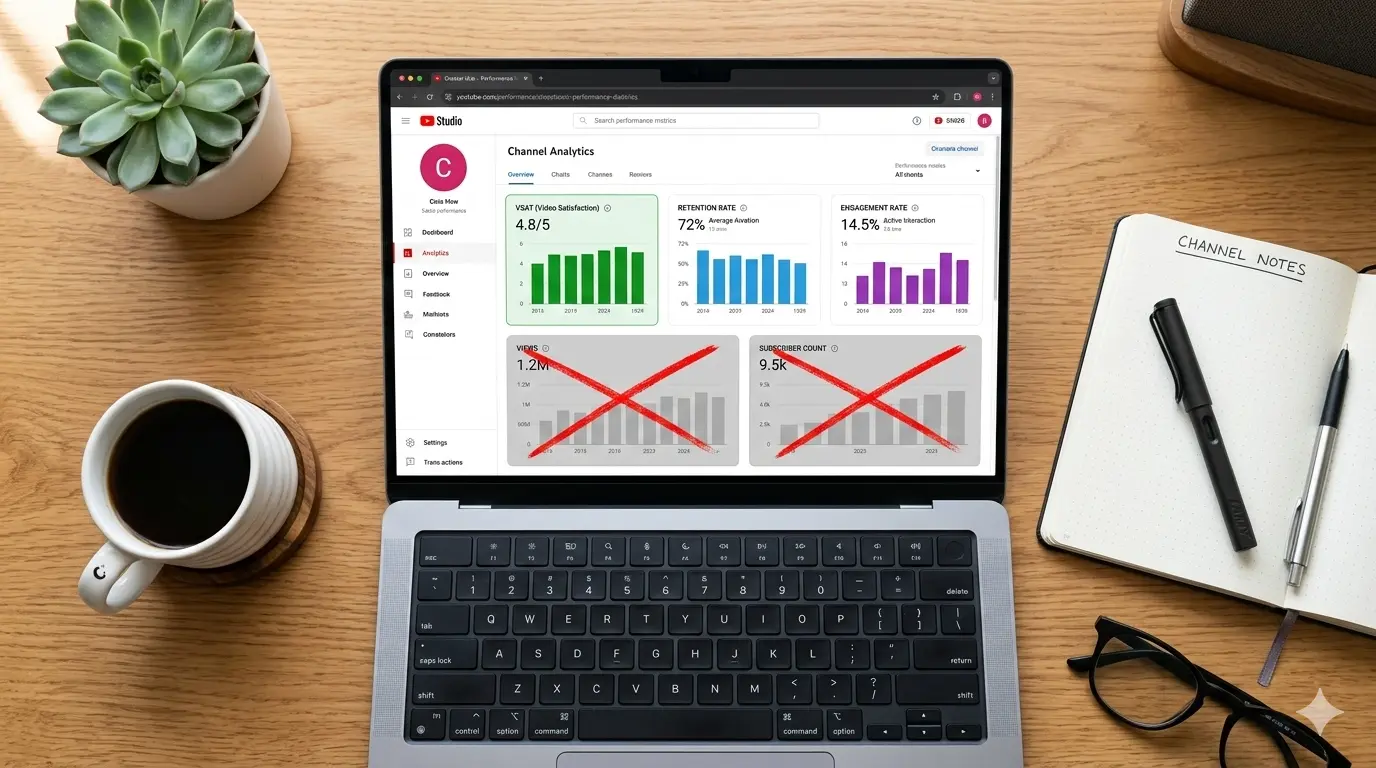
Viewer Satisfaction Score (VSAT), average percentage viewed, and engagement rate are the three metrics that directly influence how YouTube distributes your videos.
- 3
Vanity metrics like raw view count and subscriber milestones can mask underperforming content and lead creators to repeat the wrong strategy.
- 4
Use a data-first approach to audit your channel: track the metrics the algorithm rewards, not the ones that look good in screenshots.
Why Most Creators Are Tracking the Wrong Numbers
Open YouTube Studio right now and you will see dozens of numbers. Views, subscribers, watch time, impressions, likes, comments, shares, revenue — the dashboard was not designed to tell you what matters most. It was designed to show you everything. The result is that most creators celebrate the metrics that feel good and ignore the ones that actually determine whether YouTube pushes their next video to new audiences.
This article cuts through the noise. We will identify the three metrics that the YouTube recommendation engine uses as direct signals, explain exactly what each one measures, and then name the two metrics that creators obsess over despite having almost no causal relationship with channel growth.
The 3 Metrics That Actually Matter
1. VSAT — Viewer Satisfaction Score
VSAT, or Viewer Satisfaction Score, is a composite signal YouTube calculates by combining post-watch survey responses, like-to-dislike ratios, comment sentiment, and share behavior after a video ends. It is not a single number you can read directly in YouTube Studio — it is an inferred score the algorithm uses to decide whether your video made viewers happy enough to recommend it to someone else.
Think of VSAT as YouTube's answer to the question: "After watching this video, did the viewer feel their time was well spent?" A high VSAT tells the algorithm to keep surfacing your content. A low VSAT — even on a video with a million views — tells it to slow distribution. For a deeper breakdown of why this metric sits at the top of the hierarchy, read VSAT: The Only Metric That Matters for YouTube Channel Growth.
To improve your VSAT, end your videos with a clear payoff. Viewers who feel the ending delivered on the title's promise are far more likely to leave a positive survey response and share the video. Unresolved or rushed endings are the fastest way to tank this score.
2. Average Percentage Viewed (Retention Rate)
Average percentage viewed — also called the retention rate or retention curve — measures what fraction of your video the typical viewer actually watches. A 10-minute video with a 60% retention rate means the average viewer watched 6 minutes. YouTube uses this number as a proxy for content quality: if people keep watching, the content is probably good.
The retention curve inside YouTube Analytics is more useful than the single percentage number. Look for two specific patterns. First, a sharp drop in the first 30 seconds signals a weak hook — your opening is not delivering on the promise the thumbnail and title made. Second, a cliff at a specific timestamp means that moment contains a structural problem: a slow segment, a tangent, or a jarring edit. Both are fixable once you can see them.
Hook rate — the percentage of viewers who watch past the first 30 seconds — is closely related to retention and is one of the earliest signals the algorithm receives about your video. If your hook rate is suppressing reach before most viewers even get to your best content, see Why Your YouTube Hook Rate Is Killing Your Reach for a tactical fix. You can also study Pattern Interrupt Hooks (2026 Edition): Stop the Scroll and Keep Viewers Watching for proven opening structures that hold attention past that critical first half-minute.
3. Engagement Rate (Meaningful Interactions Per View)
Engagement rate measures the ratio of meaningful interactions — comments, shares, saves, and likes — to total views. It answers the question: "Of the people who watched, how many cared enough to do something?" A video with 10,000 views and 500 comments has a dramatically higher engagement rate than a video with 100,000 views and 200 comments, and the algorithm treats them very differently.
Based on AskLibra data from 4 connected channels and 511 videos analyzed, long-form content produces an average engagement rate of 0.0226 — more than double the rate seen in short-form content. This suggests that viewers who invest time in a longer video are meaningfully more likely to interact with it, which in turn sends stronger distribution signals to the algorithm.
Not all engagement carries equal weight. Comments — especially threaded replies that indicate real conversation — are weighted more heavily than passive likes. Shares are the highest-value signal because they represent a viewer staking their own reputation on your content. For a deeper look at how comment depth signals authority, see The 'Deep Reply' Weight (Threads/X): How Meaningful Comment Engagement Signals Channel Authority.
The 2 Vanity Metrics to Stop Celebrating
Vanity Metric 1: Raw View Count
View count is the number every creator watches most obsessively, and it is the least reliable indicator of channel health. A video can accumulate hundreds of thousands of views through clickbait thumbnails, misleading titles, or algorithmic flukes — and still produce near-zero VSAT, abysmal retention, and no subscriber conversion. YouTube has seen this pattern for years, which is why view count alone has almost no predictive power over whether the algorithm will recommend your next video.
Raw views also do not distinguish between an engaged viewer who watched the full video and shared it with three friends, and a bounce — someone who clicked, watched 8 seconds, and left. Both count as one view. When you optimize for view count, you are often optimizing for the metric YouTube cares least about. The number looks impressive in a screenshot. It does not pay rent.
Vanity Metric 2: Subscriber Count
Subscriber count is the social proof metric of YouTube — it signals credibility to brands and new viewers, and milestone celebrations generate community goodwill. None of that makes it a growth metric. Subscribers do not determine reach. A channel with 50,000 subscribers and a high VSAT will consistently out-distribute a channel with 500,000 subscribers and low retention, because YouTube's recommendation engine is built around satisfaction signals, not audience size.
The subscriber-to-view ratio — the percentage of your own subscribers who actually watch your new videos — is a far more honest health check. If you have 100,000 subscribers but your new videos average 3,000 views, the algorithm reads your channel as underperforming regardless of the milestone badge on your page. Subscriber count matters for brand partnerships and initial social proof, but it tells you nothing about whether your content strategy is working. To understand what actually drives distribution to both your existing subscribers and new audiences, review Social SEO: Discovery vs. Search — How YouTube's Two Traffic Engines Actually Work.
How to Build a Metrics Dashboard That Actually Guides Decisions
The practical step after reading this is to build a simple weekly review habit around the three metrics that matter. Check your retention curve for every video published in the last 30 days and mark the timestamps where viewers drop off. Calculate your engagement rate manually — total meaningful interactions divided by total views — and track it as a weekly average. Monitor post-video survey data in YouTube Studio under the "Viewer Satisfaction" section if your channel qualifies for that data.
Stop screenshotting subscriber milestones as internal KPIs. Stop letting a high-view video that had terrible retention convince you to repeat that format. The Guessing Game Is Over: Why Creators Who Don't Use Data Are Leaving Money on the Table makes the case clearly: creators who build decisions around real performance data consistently outperform those chasing surface-level numbers.
If you want to understand why certain topics consistently outperform others on your channel — regardless of individual video metrics — Topic Clustering and Content Neighborhoods: How to Organize Your YouTube Channel for Algorithmic Authority explains how topical consistency compounds your distribution advantage over time.
Frequently Asked Questions
What is VSAT and where can I find it in YouTube Studio?
VSAT stands for Viewer Satisfaction Score, a composite signal YouTube calculates from post-watch surveys, engagement patterns, and share behavior. It is not displayed as a single number in YouTube Studio, but you can find viewer satisfaction survey data under the "Research" and "Content" tabs if your channel meets the eligibility threshold for that data.
Is a 50% average percentage viewed considered good on YouTube?
A 50% retention rate is a solid benchmark for most video lengths, but context matters. Shorter videos (under 5 minutes) should aim for 60–70% or higher, while longer videos (20+ minutes) with 45–50% retention are often performing well. The more important signal is the shape of the retention curve — a gradual, consistent decline is healthier than a series of sharp drops at specific moments.
Why does subscriber count not determine how many views a video gets?
YouTube's recommendation engine prioritizes satisfaction and retention signals over audience size. When you publish a video, it is first shown to a small test audience — which may include some of your subscribers but is primarily used to measure early engagement and retention. If those signals are strong, YouTube expands distribution beyond your subscriber base. If they are weak, even a large subscriber count will not save reach.
How do I improve my engagement rate without asking viewers to like and subscribe?
Design your videos to provoke a response rather than requesting one. Ask a specific, answerable question at the end of the video that gives viewers a reason to comment. Structure your content around a debatable premise or a surprising result that viewers want to share. Genuine conversation in the comments — especially threaded replies — is worth more algorithmically than a wave of single-word likes triggered by a generic call to action.
Should I ever care about view count at all?
View count is useful for two things: benchmarking a video against your own historical average to spot outliers, and providing social proof to potential brand partners who may not have access to deeper analytics. As an internal optimization target, however, it is unreliable. A video with lower views but stronger retention, VSAT, and engagement will almost always generate more long-term channel growth than a high-view video with poor satisfaction signals.
Ready to see what the data says about your channel?
Stop guessing. Use AskLibra to get a personalized 90-day growth gameplan and find your perfect posting window.
No credit card required • Join 2,000+ creators